SAT Scoring Guide: How the 400-1600 Score Works
The complete guide to the SAT scoring scale. Master the composite math (400-1600), section scaling, Item Response Theory (IRT), and superscoring configurations.
Quick Facts
- Total Scale: Score ranges from 400 to 1600 (sum of Reading & Writing and Math section scores)
- Section Scale: Reading & Writing and Math are each scored from 200 to 800
- Scoring Algorithm: Employs Item Response Theory (IRT) based on item-level parameters
- Module Routing: Module 1 performance dictates routing to a harder or easier Module 2
- Adaptive impact: A lower-difficulty Module 2 provides less top-end score evidence
- Superscoring: Admissions offices extract highest section scores across multiple test dates
- No Penalty: Incorrect answers carry a zero penalty; guessing is highly recommended
The SAT scoring system is one of the most widely discussed yet poorly understood aspects of college admissions. For decades, students and educators analyzed the test using simple raw-to-scaled score conversion tables, expecting that a set number of correct answers would invariably yield the same scaled result. However, the introduction of the Digital SAT marked a fundamental paradigm shift in how performance is measured.
By replacing the linear paper-and-pencil test with a computer-adaptive testing framework, the College Board introduced advanced psychometric models rooted in Item Response Theory (IRT). Under this system, your final score is not merely a reflection of how many questions you answered correctly, but which questions you answered correctly, and how you navigated the section-level adaptive routing thresholds.
This guide provides a comprehensive breakdown of the Digital SAT scoring system. Whether you are aiming for a top score range or planning your study roadmap to cross the 1200 or 1400 thresholds, understanding the score scale, adaptive structure, and strategic implications of this test is critical to maximizing your performance.
Table of Contents
- Composite Score Math: The 400-1600 Scale
- Section-Level Adaptive Routing and Score Evidence
- Item Response Theory (IRT): The 3PL Psychometric Model
- Raw Scores vs. Scaled Scores: Maximum Likelihood Estimation
- Understanding Percentiles: National Representative vs. User Cohort
- Superscoring & Score Choice: Strategy and Policies
- Verbal Section Scoring Parameters
- Math Section Scoring Parameters
- Integrating Study Tools for Score Planning
- Mini-Practice Test: Sample Math & Verbal Exercises
- Official Sources, Trademark Disclaimer, and Final Notes
1. Composite Score Math: The 400-1600 Scale
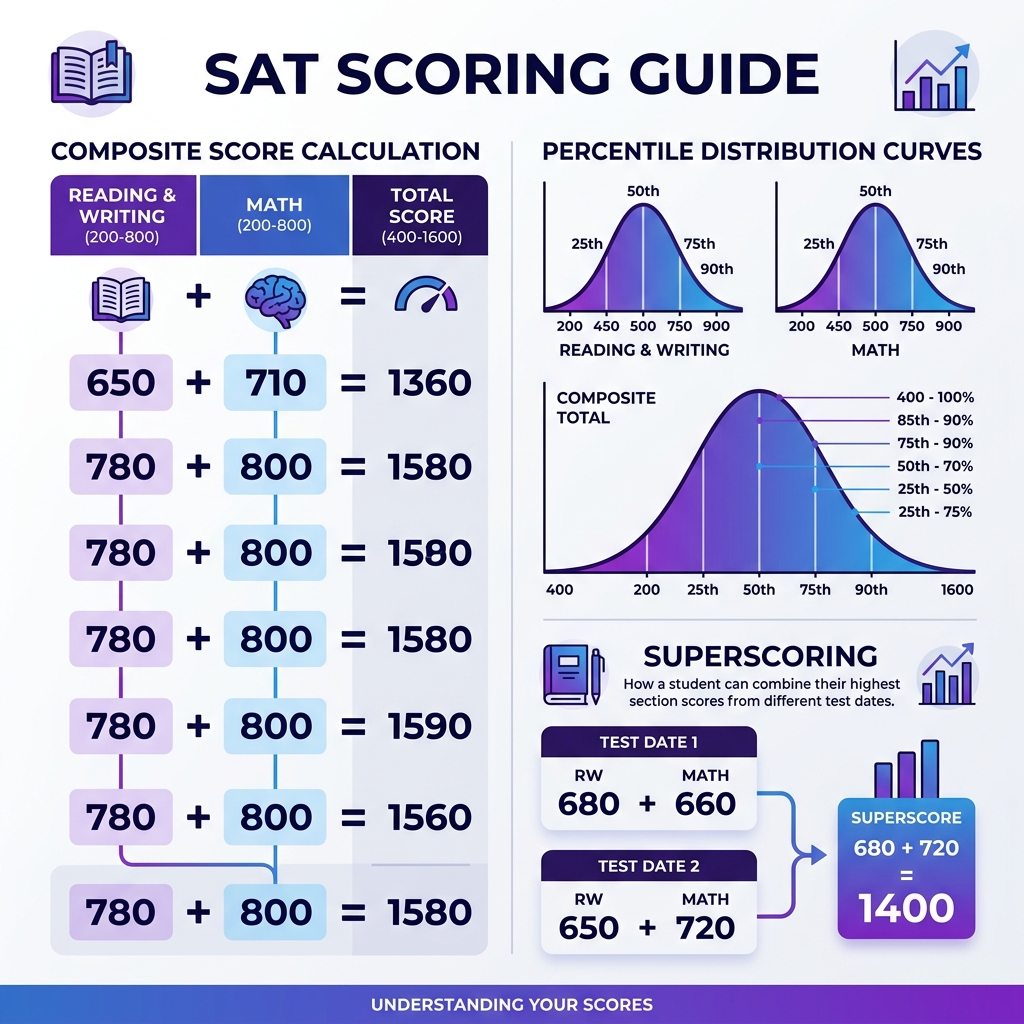
At its surface, the basic math of the SAT composite score remains unchanged. Your final score is the sum of two major section scores: \[\text{Composite Score} = \text{Reading & Writing (RW) Score} + \text{Math Score}\]
Each of the two sections is graded on a scale ranging from 200 to 800 in 10-point increments. As a result, the lowest possible score on the exam is 400, and the highest is 1600.
Why the Scale Starts at 200
Many students ask why the scoring scale starts at 200 instead of 0. If you sit for the exam, write your name, and submit blank answers for every single question, you will receive a 400 composite score (200 Verbal and 200 Math).
From a psychometric perspective, the scale is designed this way to prevent “floor effects.” In standardized testing, a score of 0 would imply a complete lack of the cognitive ability being measured. By establishing 200 as the baseline, the College Board ensures that the scoring distribution can be mapped to a standard normal curve (a bell curve) where the standard deviation represents meaningful intervals of student ability, even at the absolute lower tail of the distribution.
The Standard Deviation and the Bell Curve
The SAT is designed to produce a normal distribution of scores across the entire testing population. In a typical testing cycle:
- The mean composite score is calibrated to hover around 1000 (approximately 500 in Reading & Writing and 500 in Math).
- The standard deviation is approximately 100 points per section, or 200 points for the composite score.
This statistical distribution means that:
- Approximately 68% of all test-takers score within one standard deviation of the mean, between 800 and 1200.
- Approximately 95% of test-takers score within two standard deviations of the mean, between 600 and 1400.
- Fewer than 2.5% of students achieve a score above 1400, which represents two standard deviations above the population mean.
When you prepare for the exam, your goal is to move along this normal distribution curve. Because the density of students is highest near the middle of the curve (1000), a small increase in your scaled score near the average yields a massive leap in your percentile rank. Conversely, at the upper tail of the curve (above 1400), each 10-point scaled score increase represents a highly selective, incremental advancement in your percentile ranking.
2. Section-Level Adaptive Routing and Score Evidence
The most defining feature of the Digital SAT is its section-level adaptive structure. Unlike the old paper SAT, where every student answered the exact same set of questions in a linear sequence, the Digital SAT dynamically adjusts its difficulty based on your performance.
The Multi-Stage Testing (MST) Framework
Each of the two main sections (Reading & Writing, Math) is split into two distinct stages, known as Module 1 and Module 2:
- Module 1 (The Routing Module): This module contains a broad mix of questions representing a wide range of difficulties—roughly divided equally among easy, medium, and hard items. Every student taking a particular test administration form receives the same Module 1 questions (or an equivalent parallel set).
- Module 2 (The Adaptive Module): The computer evaluates your accuracy on Module 1 in real-time. Based on your performance, the testing software routes you to one of two versions of Module 2:
- The Harder Module 2: Contains a high concentration of medium-to-highly-difficult questions.
- The Easier Module 2: Contains a high concentration of easy-to-medium-difficulty questions.
graph TD
    A[Start Section] --> B[Module 1: Mixed Difficulty]
    B --> C{Hidden routing decision\nnot publicly fixed}
    C -- Yes --> D[Harder Module 2]
    C -- No --> E[Easier Module 2]
    D --> F[Final Scaled Score:\n400 to 800]
    E --> G[Final Scaled Score:\nLower-difficulty score evidence]
Routing Thresholds Are Not Public
The College Board does not publish the exact number of correct answers required to route to the harder Module 2, and the threshold can vary by form. Treat any third-party number as a study heuristic, not an official rule. The safe strategy is simple: protect accuracy in Module 1 because that module determines whether your second module contains a higher or lower concentration of difficult items.
The Easier Module 2 and Score Potential
If your performance on Module 1 routes you to a lower-difficulty Module 2, that can affect access to the highest section-score evidence:
[!IMPORTANT] A lower-difficulty Module 2 generally contains fewer high-difficulty scored items, so it can limit access to the highest section-score outcomes. College Board does not publish a fixed public cap, floor, or exact routing cutoff.
This scoring effect exists because the easier Module 2 contains fewer items with high difficulty parameters. Under the Item Response Theory model, the scoring engine needs evidence from harder questions to estimate higher ability levels. To maximize your section score, prioritize accuracy on Module 1 so the second module can present stronger evidence for high performance.
Conversely, routing to the harder Module 2 gives you access to more difficult scored items and more opportunity to demonstrate higher ability. It does not promise a particular score floor; your final scaled score still depends on the full response pattern and the scoring model for that administration.
3. Item Response Theory (IRT): The 3PL Psychometric Model
To understand how the raw count of correct answers translates into the final 200-800 section score, we must examine the mathematical foundation of modern psychometrics: Item Response Theory (IRT).
While classical test theory treats all questions as equal, IRT recognizes that different questions have different statistical properties. The College Board utilizes a Three-Parameter Logistic (3PL) model to calibrate and score the Digital SAT.
The 3PL Probability Formula
Under the 3PL model, the probability \(P_i(\theta)\) that a student with a latent ability level \(\theta\) will answer a specific question \(i\) correctly is expressed by the following logistic function:
\[P_i(\theta) = c_i + \frac{1 - c_i}{1 + e^{-a_i(\theta - b_i)}}\]
Where:
- \(\theta\) (Theta): The student’s latent academic ability or trait level. It is mathematically scaled as a continuous variable, typically ranging from \(-3.0\) (extremely low ability) to \(+3.0\) (extremely high ability), with a mean of \(0.0\).
- \(b_i\) (Difficulty Parameter): The location parameter of the question. It represents the point on the ability scale where the probability of a correct answer is exactly halfway between the guessing parameter \(c_i\) and \(1.0\). A question with a high \(b_i\) value (e.g., \(b_i = 2.0\)) is highly difficult, requiring a high ability level to solve.
- \(a_i\) (Discrimination Parameter): The slope parameter of the item characteristic curve at its inflection point. It measures how effectively the question distinguishes between students whose ability levels are just below and just above the item’s difficulty. A high \(a_i\) value indicates a highly discriminating question, where high-ability students are highly likely to answer correctly, while low-ability students are highly likely to answer incorrectly.
- \(c_i\) (Guessing Parameter / Lower Asymptote): The probability that a student with infinitely low ability can answer the question correctly by chance. For a standard 4-option multiple-choice question, the theoretical guessing parameter is \(0.25\), though empirical calibration often places it slightly lower (e.g., \(0.18 - 0.22\)) because of attractive distractors. For Student-Produced Responses (fill-in-the-blank math questions), the guessing parameter is \(0.0\).
- \(e\): The mathematical constant representing the base of the natural logarithm (approximately \(2.71828\)).
The Item Characteristic Curve (ICC)
Each question on the SAT has its own unique Item Characteristic Curve (ICC) generated by this formula.
- A highly difficult, highly discriminating question has a steep, S-shaped curve shifted far to the right of the graph.
- An easy, low-discrimination question has a flatter curve shifted to the left, indicating that even students with lower ability levels have a relatively high probability of answering it correctly.
Probability P(θ)
1.0 |               . - - - (High-Difficulty Item: Curve Shifted Right)
    |             /
0.5 |           /
    |         /
0.0 | _ _ . /
    +----------------------- Ability θ
         -3.0   0.0   +3.0
Item Information Functions
The psychometric utility of a question is measured by the Item Information Function \(I_i(\theta)\), which quantifies the precision of measurement that the question provides at different levels of student ability:
\[I_i(\theta) = \frac{[P_i’(\theta)]^2}{P_i(\theta)Q_i(\theta)}\]
Where:
- \(Q_i(\theta) = 1 - P_i(\theta)\) (the probability of answering incorrectly).
- \(P_i’(\theta)\) is the first derivative of the probability function \(P_i(\theta)\) with respect to \(\theta\).
The total information provided by a set of test questions is the sum of the individual item information values: \[I(\theta) = \sum_{i=1}^{n} I_i(\theta)\]
The Standard Error of Measurement \(SE(\theta)\) is inversely proportional to the square root of the total test information: \[SE(\theta) = \frac{1}{\sqrt{I(\theta)}}\]
This relationship highlights why the adaptive routing is so powerful. By routing high-ability students to a harder Module 2, the testing software selects questions that maximize \(I(\theta)\) near the student’s estimated ability level \(\theta\). This minimizes the standard error of measurement, providing an extremely precise score estimate without requiring the student to sit through a long, 100-question linear exam.
4. Raw Scores vs. Scaled Scores: Maximum Likelihood Estimation
Because the Digital SAT uses IRT, there is no static table that converts your raw score (the count of correct answers) directly to your scaled score. Instead, your score is calculated using an optimization algorithm known as Maximum Likelihood Estimation (MLE).
The Likelihood Function
When you complete a section, the scoring software records your responses as a vector \(U = (u_1, u_2, …, u_n)\), where \(u_i = 1\) if you answered question \(i\) correctly, and \(u_i = 0\) if you answered incorrectly.
The scoring engine constructs a likelihood function \(L(\theta)\) representing the probability of achieving your exact response pattern given different possible ability levels \(\theta\):
\[L(\theta | U) = \prod_{i=1}^{n} P_i(\theta)^{u_i} [1 - P_i(\theta)]^{1 - u_i}\]
The scoring engine then runs an iterative numerical method (such as the Newton-Raphson method) to locate the value of \(\theta\) that maximizes this likelihood function. This maximum point is your estimated ability parameter, denoted as \(\hat{\theta}\).
Expected A Posteriori (EAP) Bayesian Scoring
In cases where a student answers every single question in a module correctly or incorrectly, pure MLE fails because the likelihood function does not converge to a finite maximum (it trends toward infinity or negative infinity). To prevent this, the College Board uses Expected A Posteriori (EAP) scoring, a Bayesian estimation method. EAP integrates the likelihood function with a prior probability distribution of ability, typically a standard normal distribution \(g(\theta) \sim N(0, 1)\):
\[\hat{\theta}{EAP} = \frac{\int{-\infty}^{\infty} \theta L(\theta) g(\theta) d\theta}{\int_{-\infty}^{\infty} L(\theta) g(\theta) d\theta}\]
This integration ensures that every student receives a stable, bounded ability estimate, which is then mapped via a linear transformation to the final 200-800 scaled score.
Why Question Selection Matters: A Hypothetical Case Study
To illustrate how MLE and IRT can affect score estimates, consider two hypothetical students, Student A and Student B, who complete the same Reading & Writing practice form with identical raw counts. Assume both students receive a more difficult second module and finish with the same total number of correct answers.
In classical test theory, both students would receive the exact same score because their raw counts are identical (33 correct answers total). Under the IRT model, however, their scores can diverge significantly:
| Student | Questions Missed | Question Parameters | Latent Ability \(\hat{\theta}\) | Scaled Section Score |
|---|---|---|---|---|
| Student A | Missed 9 highly difficult questions with low discrimination. | Question difficulties: \(b_i > 1.8\). Discrimination: \(a_i < 0.8\). | High (demonstrated consistent mastery of core/hard concepts). | 670 |
| Student B | Missed 9 easy-to-medium questions with high discrimination. | Question difficulties: \(b_i \approx -0.5\). Discrimination: \(a_i > 1.6\). | Medium-Low (struggled with basic concepts, flagged as inconsistent). | 610 |
Student A missed only the hardest, least-discriminating questions on the test. The scoring engine determines that Student A’s ability level \(\theta\) is high, attributing the misses to high difficulty.
Student B, however, missed several easy-to-medium questions that high-ability students almost always answer correctly. The scoring engine penalizes Student B because missing highly discriminating, low-difficulty questions suggests gaps in core knowledge or careless execution. As a result, Student B’s estimated ability \(\theta\) is lower, leading to a scaled score that is 60 points below Student A’s, despite having the exact same raw count of correct answers.
5. Understanding Percentiles: National Representative vs. User Cohort
When you receive your official SAT score report, you will find your scaled scores accompanied by two distinct percentile rankings. Understanding the difference between these percentiles is essential for evaluating your competitiveness in college admissions.
1. Nationally Representative Sample Percentile
This percentile compares your performance to the estimated performance of all U.S. students in your grade, regardless of whether they typically take the SAT or plan to attend college.
- The College Board generates this cohort using a weighted sample of the national high school student population.
- Because this sample includes millions of students who do not take standardized tests or participate in college prep programs, the overall average score of this cohort is lower than that of actual test-takers.
- As a result, your Nationally Representative Percentile will always be higher than your User Percentile. For example, a composite score of 1200 might place you in the 81st percentile of the Nationally Representative Sample, suggesting you outperformed 81% of all U.S. juniors or seniors.
2. SAT User Percentile
This percentile compares your performance only to students who actually took the SAT.
- This cohort represents a self-selected, highly academic group of college-bound students.
- Because the baseline ability of this group is higher, achieving a high percentile rank is more difficult.
- For the same 1200 composite score, your SAT User Percentile might be only the 74th percentile.
[!IMPORTANT] College admissions offices rely almost exclusively on the SAT User Percentile when evaluating applications. When reviewing score statistics for target universities, ignore the Nationally Representative Percentile and focus entirely on how your score aligns with the User Percentile ranges.
Comprehensive Score-to-Percentile Mapping
The table below illustrates the typical relationship between scaled composite scores, section scores, and their corresponding SAT User Percentiles:
| Composite Score | Section Score (Equal Split) | SAT User Percentile | Admissions Classification |
|---|---|---|---|
| 1600 | 800 | 99+ | Highly Competitive (Ivy League / Elite) |
| 1550 | 770 / 780 | 99 | Highly Competitive (Ivy League / Elite) |
| 1500 | 750 | 98 | Highly Competitive (Top 20 National Universities) |
| 1450 | 720 / 730 | 96 | Very Competitive (Top 40 National Universities) |
| 1400 | 700 | 93 | Very Competitive (Top 50 National Universities) |
| 1350 | 670 / 680 | 89 | Competitive (Top 75 National Universities) |
| 1300 | 650 | 84 | Competitive (State Flagships / Selective Colleges) |
| 1200 | 600 | 74 | Above Average (Selective Regional Colleges) |
| 1100 | 550 | 61 | Average / Above Average (Broad Access Colleges) |
| 1000 | 500 | 47 | National Median |
| 900 | 450 | 32 | Below Average |
| 800 | 400 | 17 | Below Average |
6. Superscoring & Score Choice: Strategy and Policies
Given the high stakes of college admissions, very few students submit scores from a single test administration. Instead, they leverage two key College Board and institutional policies: Score Choice and Superscoring.
Score Choice Mechanics
Score Choice is an official College Board service that allows you to select which test date scores you want to submit to colleges.
- For example, if you take the SAT in March, May, and October of your junior year, you can choose to send only your October scores to your target universities.
- The admissions offices at those schools will only see the scores from the specific date you selected; they will not see your scores from March or May, nor will they know how many times you took the exam.
Superscoring Mechanics
Superscoring is an institutional policy practiced by the vast majority of colleges and universities in the United States.
Under a superscore policy, the admissions office does not look at your composite score from a single test date. Instead, they extract your highest Reading & Writing score and your highest Math score from across all test dates you submit, summing those section maximums to compile a new, optimized composite score.
Example Scenario
Consider a student who takes the SAT three times during their junior and senior years:
| Test Date | Reading & Writing Score | Math Score | Composite Score |
|---|---|---|---|
| March Administration | 680 | 620 | 1300 |
| June Administration | 640 | 710 | 1350 |
| October Administration | 700 | 690 | 1390 |
| Superscore Output | 700 (Oct) | 710 (June) | 1410 (Calculated) |
By submitting the scores from all three test dates, this student’s official score profile at a superscoring college becomes a 1410, which is 20 points higher than their best single-day composite score of 1390.
Admissions Policies Matrix
While most universities superscore, policies vary. The table below outlines the three primary score submission policies you will encounter:
| Policy Type | Description | Student Action Strategy |
|---|---|---|
| All Scores Required | The university requires you to submit every score from every test date you have taken. Score Choice is not permitted. | You must submit all scores. Admissions offices still often focus on the highest section scores, but they will see any lower baseline performances. |
| Superscore / Score Choice | The university allows you to use Score Choice, and they will superscore the dates you choose to send. | Submit only the specific test dates that contain your highest Reading & Writing and Math scores. Do not send dates with lower scores across both sections. |
| Single Highest Date | The university does not superscore. They evaluate your application based on your single highest composite score from a single test date. | Submit only the test date that yielded your highest single-day composite score. |
7. Verbal Section Scoring Parameters
The Reading & Writing (RW) section consists of 54 questions total, split into two modules of 27 questions each.
Module Structure and Timing
- Total Questions per Module: 27 (25 active questions that count toward your score, and 2 pretest/experimental questions).
- Time Limit per Module: 32 minutes.
- Average Time per Question: 71 seconds.
The Four Verbal Content Domains
The scoring engine evaluates your verbal ability across four content domains, each representing a specific percentage of the total section points:
- Craft and Structure (approx. 28% of section score): Focuses on words in context, text structure, and cross-text connections. These questions test high-level vocabulary, reading comprehension, and comparative reasoning.
- Information and Ideas (approx. 28% of section score): Focuses on central ideas, details, command of evidence (textual and quantitative), and logical inferences. These questions require you to analyze arguments and evaluate data tables or graphs.
- Expression of Ideas (approx. 20% of section score): Focuses on transition words and rhetorical synthesis (organizing student notes into a structured sentence).
- Standard English Conventions (approx. 24% of section score): Focuses on grammar, punctuation, verb tenses, subject-verb agreement, pronoun usage, and sentence boundaries.
Original Verbal Example 1: Standard English Conventions (Punctuation)
To secure a high score in Standard English Conventions, you must master the precise boundaries between independent and dependent clauses. Let’s analyze a typical SAT-style conventions question:
Passage: In her landmark study on urban microclimates, climatologist Dr. Elena Vance observed that green spaces can lower local temperatures ______ parks containing mature tree canopies exhibited temperature reductions up to \(4^\circ\text{C}\) compared to surrounding concrete surfaces.
Which choice completes the text with the most logical punctuation?
- A) temperatures, specifically,
- B) temperatures; specifically,
- C) temperatures specifically,
- D) temperatures: specifically
Step-by-Step Explanation:
- Analyze the clause structures:
- The clause before the blank is: “In her landmark study on urban microclimates, climatologist Dr. Elena Vance observed that green spaces can lower local temperatures…” This contains a subject (Dr. Elena Vance) and a verb (observed), followed by a noun clause serving as the direct object. This is a complete independent clause.
- The clause after the blank is: “…parks containing mature tree canopies exhibited temperature reductions up to \(4^\circ\text{C}\) compared to surrounding concrete surfaces.” This contains a subject (parks) and a verb (exhibited). This is also a complete independent clause.
- Determine the punctuation rule:
- Connecting two independent clauses requires a coordinating conjunction (with a comma), a semicolon, or a colon. A comma alone results in a comma splice.
- The word specifically is a transition word (adverb) that introduces an explanation or example of the preceding clause.
- Evaluate the options:
- A) temperatures, specifically,: Placing a comma before specifically and another comma after it results in a comma splice. The transition specifically is acting as a conjunctive adverb connecting two independent clauses, which cannot be done with commas alone. Incorrect.
- B) temperatures; specifically,: The semicolon correctly separates the two independent clauses. The conjunctive adverb specifically is placed at the start of the second independent clause, followed by a comma to set it off. This is grammatically correct.
- C) temperatures specifically,: Lacks punctuation between the two clauses, resulting in a run-on sentence. Incorrect.
- D) temperatures: specifically: While a colon can connect two independent clauses when the second explains or illustrates the first, we still need a comma after the transition word specifically when it opens the second clause. Lacking this comma makes the choice incorrect.
The correct choice is B.
Original Verbal Example 2: Craft and Structure (Words in Context)
Words in Context questions test your ability to determine the meaning of vocabulary words based on surrounding context clues, rather than simple rote memorization.
Passage: Although many art historians have characterized the painter’s late-career work as a radical departure from her early style, a close comparison of the two periods reveals that this transition was far from ______; indeed, the recurring thematic motifs of her early landscapes remain clearly discernible in her later abstract canvases.
Which choice completes the passage with the most logical and precise word?
- A) abrupt
- B) deliberate
- C) derivative
- D) aesthetic
Step-by-Step Explanation:
- Identify the transition words and logic:
- The passage opens with the contrast transition Although, indicating that the second clause will run counter to the common characterization of the painter’s late-career work.
- Art historians characterize the work as a “radical departure” (a sudden, major change).
- The second clause states that a close comparison reveals this transition was “far from [blank]”.
- The sentence continues with the transition indeed, reinforcing the idea that the transition was not sudden: “the recurring thematic motifs of her early landscapes remain clearly discernible in her later abstract canvases.”
- Formulate a prediction word:
- If the transition was not a radical departure, and early motifs are still clearly visible, the transition was not sudden, disjointed, or unexpected. A good prediction word is sudden or abrupt.
- Evaluate the choices:
- A) abrupt: Means sudden or unexpected. If the transition was “far from abrupt”, it means it was gradual and connected, which matches the clue that early motifs are still visible. This is the correct choice.
- B) deliberate: Means done consciously or intentionally. The context is not about intent, but about the speed and continuity of the stylistic change. Incorrect.
- C) derivative: Means imitative or unoriginal. This does not fit the contrast with “radical departure.” Incorrect.
- D) aesthetic: Relating to beauty or art. This is too general and does not address the continuity of the transition. Incorrect.
The correct choice is A.
8. Math Section Scoring Parameters
The Math section consists of 44 questions total, split into two modules of 22 questions each.
Module Structure and Timing
- Total Questions per Module: 22 (20 active questions that count toward your score, and 2 pretest/experimental questions).
- Time Limit per Module: 35 minutes.
- Average Time per Question: 95 seconds.
The Four Math Content Domains
The Math section tests your quantitative reasoning across four domains, each accounting for a specific portion of the section score:
- Algebra (approx. 35% of section score): Focuses on linear equations, systems of linear equations, inequalities, and their graphs.
- Advanced Math (approx. 35% of section score): Focuses on quadratic equations, exponential functions, radical and rational equations, polynomial factors, and systems of non-linear equations.
- Problem Solving and Data Analysis (approx. 15% of section score): Focuses on ratios, rates, proportions, percentages, probability, unit conversions, and statistical measures (mean, median, standard deviation, line of best fit).
- Geometry and Trigonometry (approx. 15% of section score): Focuses on area and volume, right triangles, trigonometry, circle equations, and theorems regarding lines and angles.
Student-Produced Responses (SPRs)
Unlike multiple-choice questions, Student-Produced Responses (SPRs) do not provide answer options. You must solve the problem and enter your numerical answer directly into the testing interface.
- SPRs account for approximately 25% of the Math questions (typically 5 to 6 questions per module).
- Under the IRT scoring model, SPRs carry the exact same scoring weight as multiple-choice questions. Because they do not have a guessing parameter (i.e., \(c_i = 0\)), there is no statistical guessing floor.
- You should never leave an SPR blank. While guessing on a multiple-choice question offers a 25% chance of success, entering a reasoned guess on an SPR is still preferable to leaving the response empty.
Original Math Example 1: Circle Equation Geometry
Standard circle equations are a frequent source of medium-to-hard questions in the Geometry and Trigonometry domain.
Question: In the coordinate plane, the equation of a circle is represented by: \[x^2 + y^2 - 16x + 8y = -31\] What is the area of the circle?
Step-by-Step Algebraic Solution:
- Recall the Circle Area Formula: The area \(A\) of a circle is calculated using the formula: \[A = \pi r^2\] To find the radius squared \(r^2\), we must convert the given general quadratic equation of the circle into its standard center-radius form: \[(x - h)^2 + (y - k)^2 = r^2\] where \((h, k)\) is the center of the circle, and \(r\) is the radius.
- Group the variables: Group the \(x\) terms together and the \(y\) terms together: \[(x^2 - 16x) + (y^2 + 8y) = -31\]
- Complete the square for the \(x\) terms: Take the coefficient of the \(x\) term (\(-16\)), divide it by 2 (\(-8\)), and square it (\(64\)). Add this value to both sides of the equation: \[(x^2 - 16x + 64) + (y^2 + 8y) = -31 + 64\]
- Complete the square for the \(y\) terms: Take the coefficient of the \(y\) term (\(8\)), divide it by 2 (\(4\)), and square it (\(16\)). Add this value to both sides of the equation: \[(x^2 - 16x + 64) + (y^2 + 8y + 16) = -31 + 64 + 16\]
- Factor the trinomials into perfect squares: Factor the grouped terms on the left side and simplify the constants on the right side: \[(x - 8)^2 + (y + 4)^2 = 49\]
- Identify \(r^2\) and calculate the area: Comparing this to the standard equation \((x - h)^2 + (y - k)^2 = r^2\), we see that: \[r^2 = 49\] Now, substitute \(r^2\) back into the circle area formula: \[A = \pi r^2 = 49\pi\]
The area of the circle is \(49\pi\).
Original Math Example 2: Exponential Growth and Decay
Exponential modeling questions appear frequently in the Advanced Math and Problem Solving domains.
Question: The population of a particular species of phytoplankton in a controlled laboratory environment increases by \(15%\) every \(4\) hours. If the initial population of the culture is \(1,200\) cells, which function represents the population \(P(t)\) of the culture after \(t\) hours?
- A) \(P(t) = 1,200(1.15)^{4t}\)
- B) \(P(t) = 1,200(0.85)^{\frac{t}{4}}\)
- C) \(P(t) = 1,200(1.15)^{\frac{t}{4}}\)
- D) \(P(t) = 1,200(1.15)^{\frac{4}{t}}\)
Step-by-Step Solution:
- Analyze the exponential growth model:
The general formula for exponential growth or decay over a specific interval is:
\[P(t) = P_0(1 + r)^{\frac{t}{d}}\]
Where:
- \(P_0\) is the initial population value (1,200).
- \(r\) is the rate of growth expressed as a decimal (\(15% = 0.15\)).
- \(d\) is the duration of the time interval required for the growth to occur (4 hours).
- \(t\) is the elapsed time in hours.
- Substitute the given parameters:
- The growth factor is \(1 + r = 1 + 0.15 = 1.15\).
- The exponent is \(\frac{t}{d} = \frac{t}{4}\), representing the number of 4-hour periods that have passed in \(t\) hours.
- Substituting these yields: \[P(t) = 1,200(1.15)^{\frac{t}{4}}\]
- Evaluate the options:
- Option A applies the interval multiplier \(4\) as a product \(4t\) instead of a division, representing a rate that grows 16 times too fast.
- Option B represents an exponential decay of \(15%\) (since \(1 - 0.15 = 0.85\)).
- Option C matches the constructed formula.
- Option D uses an inverse ratio \(\frac{4}{t}\), which is mathematically incorrect.
The correct choice is C.
9. Integrating Study Tools for Score Planning
A common mistake students make is preparing for the SAT without establishing baseline measurements. To make the most of your prep cycle, you should integrate study planning tools to organize your timeline.
Phase 1: Establish Your Baseline
Do not start studying by reading prep books page-by-page. Instead, take a full-length, official diagnostic practice test in the Bluebook app. This serves two purposes:
- It simulates the test-day environment, including the adaptive routing mechanics.
- It generates a baseline score report, helping you identify which question types and domains (e.g., Standard English Conventions, Algebra) need the most focus.
Phase 2: Set a Target Score and Timeline
Once you have your baseline score, use a Score Goal Planner to establish a realistic target. If your baseline is a 1000, aiming for a 1500 in three weeks is mathematically unrealistic. A structured growth plan typically targets 50 to 100 points of improvement per month of consistent practice.
Pair your goal planning with an SAT Countdown Timer to track the weeks remaining until your registered test date. This helps prevent cramming and ensures you distribute your practice tests evenly.
Phase 3: Generate a Customized Study Plan
Use a Study Plan Generator to divide your preparation into manageable weekly tasks. A balanced plan should allocate:
- 60% of your study time to conceptual review (learning the grammar rules, coordinate geometry formulas, or algebraic methods you missed on your diagnostic test).
- 30% of your study time to timed practice questions, helping you build pacing reflexes for the 71-second (Verbal) and 95-second (Math) per-question limits.
- 10% of your study time to reviewing your errors in a dedicated log.
10. Mini-Practice Test: Sample Math & Verbal Exercises
Apply the scoring and content strategies discussed in this guide to the following 6 practice questions. Each question is designed to match the format, difficulty, and skill requirements of the Digital SAT.
Reading & Writing Section
Question 1: Craft and Structure (Words in Context)
The curator argued that the artist’s late sculptures, often constructed from scrap metal and discarded industrial components, represent a ______ of modern consumer culture rather than a celebration of it; by elevating industrial waste to the status of fine art, the artist highlights the environmental costs of mass production.
Which choice completes the passage with the most logical and precise word?
- A) critique
- B) synthesis
- C) validation
- D) replication
Answer & Explanation:
- Answer: A) critique
- Explanation: The passage sets up a contrast using the phrase “rather than a celebration of it.” The correct word must mean the opposite of celebration, while aligning with the clue that the artist “highlights the environmental costs of mass production.” Critique (an analysis or evaluation, often critical) fits this context. Synthesis (combination), validation (approval), and replication (copying) do not support the critical stance toward mass consumer culture described in the passage.
Question 2: Expression of Ideas (Transitions)
In the early 20th century, astronomer Henrietta Swan Leavitt discovered the relationship between the luminosity and period of Cepheid variable stars, a finding that allowed astronomers to measure the distances to faraway galaxies. ______ Edwin Hubble used Leavitt’s period-luminosity relation to determine that the Andromeda Nebula was actually a separate galaxy outside of our own, resolving a major debate about the scale of the universe.
Which choice completes the text with the most logical transition?
- A) Conversely,
- B) Subsequently,
- C) Specifically,
- D) Nevertheless,
Answer & Explanation:
- Answer: B) Subsequently,
- Explanation: The first sentence describes Leavitt’s discovery of the period-luminosity relation. The second sentence describes how Edwin Hubble later used that discovery to determine the distance to the Andromeda Nebula. This is a chronological sequence where one event builds upon another. Subsequently (meaning afterward or following) correctly models this relationship. Conversely (contrast), Specifically (illustration of a general point), and Nevertheless (concession/contrast) do not fit.
Question 3: Standard English Conventions (Punctuation)
To determine the composition of distant exoplanets, astrophysicists analyze the light passing through the planets’ atmospheres during transit ______ chemical elements absorb specific wavelengths of light, creating dark absorption lines in the observed spectrum that serve as chemical signatures.
Which choice completes the text with the most logical punctuation?
- A) transit, because,
- B) transit. Because
- C) transit; because
- D) transit because
Answer & Explanation:
- Answer: D) transit because
- Explanation: The passage contains two clauses. The first is an independent clause: “To determine the composition of distant exoplanets, astrophysicists analyze the light passing through the planets’ atmospheres during transit.” The second is a dependent clause starting with the subordinating conjunction because: “because chemical elements absorb specific wavelengths of light…” A subordinating conjunction introducing a dependent clause at the end of a sentence should not be separated from the independent clause by a comma, semicolon, or period. Therefore, no punctuation is needed before because, nor should there be a comma after it. Choice D is correct.
Math Section
Question 4: Algebra (Systems of Linear Equations)
A local bakery sells boxes of cookies and boxes of pastries. A box of cookies costs \($12\), and a box of pastries costs \($18\). On Saturday, the bakery sold a total of \(65\) boxes of cookies and pastries, generating \($990\) in revenue. How many boxes of cookies did the bakery sell?
Answer & Explanation:
- Answer: 30
- Explanation: Let \(c\) represent the number of boxes of cookies sold, and \(p\) represent the number of boxes of pastries sold. We can construct a system of linear equations based on the problem:
- The total number of boxes sold: \[c + p = 65\]
- The total revenue generated: \[12c + 18p = 990\] Solve the system using substitution or elimination. Using elimination: Multiply the first equation by 12: \[12c + 12p = 780\] Subtract this from the revenue equation: \[(12c + 18p) - (12c + 12p) = 990 - 780\] \[6p = 210 \implies p = 35\] Substitute \(p = 35\) back into the first equation to find \(c\): \[c + 35 = 65 \implies c = 30\] The bakery sold 30 boxes of cookies.
Question 5: Advanced Math (Quadratic Systems)
A quadratic function is defined by: \[f(x) = 2x^2 - 12x + 11\] What is the minimum value of the function?
Answer & Explanation:
- Answer: -7
- Explanation: The minimum value of a quadratic function \(f(x) = ax^2 + bx + c\) where \(a > 0\) occurs at its vertex.
- Find the x-coordinate of the vertex using the formula \(x = -\frac{b}{2a}\): \[x = -\frac{-12}{2(2)} = \frac{12}{4} = 3\]
- Evaluate the function at \(x = 3\) to find the minimum value (the y-coordinate of the vertex): \[f(3) = 2(3)^2 - 12(3) + 11\] \[f(3) = 2(9) - 36 + 11\] \[f(3) = 18 - 36 + 11 = -7\] The minimum value of the function is -7.
Question 6: Geometry and Trigonometry (Right Triangle Trigonometry)
In right triangle \(ABC\), the measure of angle \(C\) is \(90^\circ\), and \(\cos(A) = \frac{5}{13}\). What is the value of \(\sin(B)\)?
Answer & Explanation:
- Answer: 5/13 (or approximately 0.385)
- Explanation: In a right triangle, the acute angles \(A\) and \(B\) are complementary, meaning \(A + B = 90^\circ\). The cofunction identity in trigonometry states that the cosine of an angle is equal to the sine of its complement: \[\sin(B) = \sin(90^\circ - A) = \cos(A)\] Given that \(\cos(A) = \frac{5}{13}\), it follows that \(\sin(B)\) must also be \(\frac{5}{13}\).
11. Official Sources, Trademark Disclaimer, and Final Notes
Official Sources Box
[!NOTE] All scoring details, percentile distributions, equating methodologies, and trademark policies discussed in this guide are aligned with the official College Board guidelines. For live updates regarding the testing calendar, score release dates, and registration options, visit:
Trademark Disclaimer
SAT® and Bluebook™ are registered trademarks of the College Board, which was not involved in the production of, and does not endorse, this study guide or the resources hosted on SATHELP24x7.com.
Summary of Best Practices for Test Day
To ensure your performance is accurately captured by the scoring engine, follow these guidelines:
- Do not leave questions blank: There is no guessing penalty on the Digital SAT. A random guess carries a 25% chance of being correct, which is always better than a blank answer.
- Manage your pace in Module 1: Because your performance on Module 1 affects whether your second module contains more difficult questions, prioritize accuracy on the first module. Running out of time on Module 1 reduces the evidence available for top-end scoring.
- Maintain an Error Log: As you practice, log the questions you answer incorrectly. Categorize them by domain to identify patterns, and re-solve them a few days later to verify you have mastered the underlying concepts.
Practice Application: SAT Scoring Guide: How the 400-1600 Score Works
Decision Example
If general prep affects a real testing decision, separate the official fact from the independent study action before acting.
Follow-Up Drill
Write one timed task, one official-source verification task, and one error-log review task based on this page.
Completion Checklist
- I can state the official fact that matters.
- I can name the independent strategy I will try.
- I have one measurable practice task scheduled.
Next Step
Use the related links below to turn this guide into practice or source verification.
Continue practice →College Board Official SAT Suite Scoring Guidelines
Frequently Asked Questions
How does the raw score convert to a scaled score on the SAT?
On the Digital SAT, the raw score (the number of questions answered correctly) is not converted to a scaled score using a simple static grid. Because the test is section-level adaptive and uses Item Response Theory (IRT), each question has different statistical weights. A correct answer on a highly difficult, high-discrimination question carries more score weight than a correct answer on an easy question. The scoring software calculates your overall ability parameter \(\theta\) using a maximum likelihood estimation model based on the specific questions you got right and wrong, and then maps that ability level to the official 200-800 section scale.
What is the difference between the two percentiles shown on my score report?
Your official score report displays two different percentile ranks: (1) The Nationally Representative Sample Percentile, which compares your performance to all U.S. students in your grade, including those who do not typically take the SAT; and (2) The SAT User Percentile, which compares your score only to students who actually took the SAT. The SAT User Percentile is typically lower than the Nationally Representative Percentile because it compares you to a more self-selected, academic group of college-bound students. Admissions offices rely almost exclusively on the SAT User Percentile when evaluating applications.
Can a student get a 1600 with incorrect answers?
Do not plan around a fixed number of misses. Digital SAT scoring is form-specific and depends on the full pattern of scored responses, including item difficulty. On some practice or official forms, a very high section score may still be possible with an error, but College Board does not publish a universal miss-count chart for 1600-level outcomes. Treat every question as important and use your official score report as the source of record.
Is there a penalty for guessing on the Math or Reading & Writing sections?
No. The College Board discontinued the guessing penalty on the SAT in 2016. On the current digital format, you receive points for correct answers, and incorrect answers carry a zero score penalty. Leaving a question blank results in zero points for that item, whereas guessing gives you a 25% chance of selecting the correct answer on multiple-choice questions. If you are running out of time, you should always select a temporary answer for all remaining questions in the module.
How do I calculate my Selection Index score for the National Merit Scholarship?
The National Merit Scholarship Corporation calculates your Selection Index (SI) score directly from your junior-year PSAT/NMSQT section scores. The formula is: \(SI = 2 \times (\text{Reading \& Writing Score} / 10) + (\text{Math Score} / 10)\). For example, if you score a 720 on Reading & Writing and a 680 on Math, your Selection Index is: \(SI = 2 \times 72 + 68 = 144 + 68 = 212\). Each state has a different qualifying Selection Index cutoff score representing the top 1% of juniors in that state.
What is the difference between Score Choice and Superscoring?
Score Choice is a College Board policy that allows you to choose which official test dates you want to submit to colleges. For example, if you took the test in March and June, you can choose to send only your June scores. Superscoring is a policy held by individual colleges, where the admissions office will extract your highest Reading & Writing score and your highest Math score from across all submitted test dates to compile your highest possible composite score. Most competitive universities practice superscoring.
How does a lower-difficulty Module 2 affect score potential?
If Module 1 performance routes you to a lower-difficulty Module 2, the section contains fewer high-difficulty items. That gives the scoring model less evidence for top-end ability. College Board does not publish a fixed public score cap or routing cutoff, so prioritize Module 1 accuracy without relying on unofficial threshold numbers.
Are the Math Student-Produced Responses scored differently than multiple-choice questions?
No special bonus or penalty applies just because a Math question is student-produced response instead of multiple choice. The digital SAT scoring model uses item difficulty and response patterns, so every scored question should be treated as important. The operational difference is that SPR questions require you to type the answer into a text box, which increases the chance of execution errors such as a missing decimal point or negative sign.
Do the experimental/pretest questions affect my SAT score?
No. Each module of the Digital SAT contains 2 pretest (experimental) questions that are indistinguishable from active questions. These questions are being evaluated for difficulty and discrimination parameters to be used in future test administrations. Because they do not count toward your raw or scaled score, they are not factored into the Item Response Theory estimation of your ability level \(\theta\). However, because you cannot identify which questions are pretest, you must treat every question with the same level of focus and effort.
Is the SAT score curved based on the performance of other students who took the test on the same day?
No, the SAT is not curved based on the performance of other test-takers on your specific test day. Instead, the College Board uses a process called equating. Equating uses Item Response Theory (IRT) to adjust for differences in difficulty between different test forms. This means that a score of 1400 on a test form administered in March represents the exact same level of ability \(\theta\) as a score of 1400 on a test form administered in June, regardless of whether the group of students taking the test in March was overall more or less capable than the June group.