1. What is a Linear Function?
A linear function represents a straight line when graphed. It can be written in the general form: \[ y = mx + b \]
Here:
- \( m \) is the slope of the line.
- \( b \) is the y-intercept, the point where the line crosses the y-axis.
2. The Slope (\( m \)):
The slope is a measure of the steepness or the inclination of the line. It represents the rate of change of one quantity with respect to another.
- If \( m > 0 \), the function is increasing: as \( x \) increases, \( y \) increases.
- If \( m < 0 \), the function is decreasing: as \( x \) increases, \( y \) decreases.
- If \( m = 0 \), the function is constant: \( y \) doesn't change as \( x \) changes.
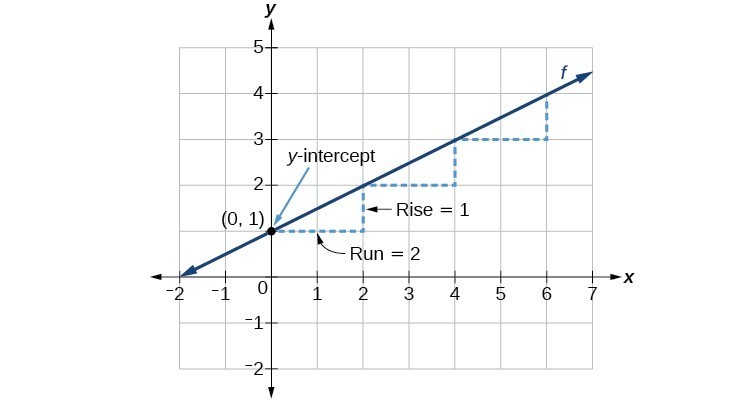
The value of \( m \) can be interpreted as "rise over run." That is, for every increase of 1 unit in \( x \), \( y \) will increase by \( m \) units.
3. The Y-Intercept (\( b \)):
The y-intercept, \( b \), is the value of \( y \) when \( x = 0 \). It tells us where the line intersects or "cuts" the y-axis. In real-world scenarios, this can often represent a starting value or a base amount before any changes are considered.
4. Real-World Interpretation:
Linear functions often model real-world scenarios where there's a consistent rate of change.
Example: Suppose you're saving money and you decide to save $50 every week. You already have $200 saved up.
- Equation: The linear function that represents this scenario is \( y = 50x + 200 \).
- Interpretation:
- The slope \( m = 50 \) means that for every week (increase by 1 in \( x \)), your savings increase by $50.
- The y-intercept \( b = 200 \) tells us that you started with $200.
If you want to know how much you'll have saved up after 10 weeks, plug in \( x = 10 \): \[ y = 50(10) + 200 = 700 \] After 10 weeks, you'll have $700.
5. Graphical Interpretation:
When graphing the function \( y = 50x + 200 \):
- Start by plotting the y-intercept (0, 200).
- From there, use the slope to find the next point. Since the slope is 50 (or 50/1), you'll rise 50 units and run 1 unit to the right.
- Continue plotting points and then draw a straight line through them.
Final Thoughts:
Linear functions provide a straightforward way to understand and predict relationships that have a constant rate of change. They are foundational in mathematics and are commonly used in various real-world applications, from finance to physics. Understanding the components of a linear function, especially the slope and y-intercept, provides valuable insights into the nature of the relationship it represents.
Linear Functions Quiz:
1. Which of the following represents the general form of a linear function?
- A) \( y = m^2 + b \)
- B) \( y = mx^2 + b \)
- C) \( y = mx + b \)
- D) \( y = \frac{m}{x} + b \)
2. What does the slope in a linear function indicate?
- A) The x-intercept of the line.
- B) The steepness or inclination of the line.
- C) The y-coordinate of the graph.
- D) The height of the graph.
3. If the slope of a linear function is negative, the line will:
- A) Rise to the right.
- B) Remain horizontal.
- C) Fall to the right.
- D) Become a curve.
4. The y-intercept of the function \( y = 4x + 3 \) is:
- A) 4
- B) 0
- C) 3
- D) -3
5. If a linear function has a slope of 0, it means the line is:
- A) Vertical
- B) Horizontal
- C) Increasing
- D) Decreasing
6. A line has an equation of \( y = 2x + 5 \). If \( x = 3 \), what is the value of \( y \)?
- A) 6
- B) 11
- C) 10
- D) 16
7. Which of the following equations represents a line with a slope of 5 and a y-intercept of -3?
- A) \( y = -3x + 5 \)
- B) \( y = 5x - 3 \)
- C) \( y = 3x + 5 \)
- D) \( y = 5x + 3 \)
8. The slope of a line passing through the points (4,7) and (2,3) is:
- A) 1
- B) 2
- C) 4
- D) -2
9. What does the y-intercept represent in a real-world scenario?
- A) The rate of change
- B) The maximum value
- C) The starting or base value
- D) The end value
10. A line that represents a constant value, say 7, will have an equation of:
- A) \( y = 7x \)
- B) \( x = 7 \)
- C) \( y = 7 \)
- D) \( y = x + 7 \)
Answers:
- C
- B
- C
- C
- B
- D
- B
- B
- C
- C